

Bitcoin’s 20% slide is catching investors off guard. What makes this particular downturn fascinating—and frankly, unsettling for many—is the absence of any catastrophic news or regulatory crackdown. No exchange collapses, no government bans, no security breaches. Just a steady, relentless decline that has left market participants scrambling for explanations. When Bitcoin’s 20% slide occurs in a vacuum of negative catalysts, we must dig deeper into the mechanics of market structure, the shadowy movements of whale wallets, and the powerful psychological forces that govern crypto trading behaviour.
This analysis explores the multifaceted reasons behind significant price corrections in the world’s leading cryptocurrency, examining technical factors, institutional movements, and behavioural economics that combine to create perfect storm conditions for major selloffs.
Bitcoin’s Recent Price Action
The Magnitude of Bitcoin’s 20% Slide
To fully grasp the implications of Bitcoin’s 20% slide, we need context. A 20% correction in traditional markets would trigger circuit breakers and dominate headlines for weeks. In cryptocurrency markets, such movements have become almost routine, yet each instance deserves careful examination. This particular decline saw Bitcoin drop from approximately $100,000 to around $80,000 within weeks, erasing billions in market capitalisation and liquidating leveraged positions across multiple exchanges.
The speed and severity of the decline caught many analysts by surprise, particularly those who had been calling for Bitcoin to reach $150,000 or higher following recent institutional adoption milestones. What started as profit-taking quickly cascaded into a broader market rout, affecting not just Bitcoin but the entire cryptocurrency ecosystem.
Historical Context of Major Bitcoin Corrections
Bitcoin price corrections of 20% or more are not unprecedented. Historical data shows that Bitcoin has experienced similar or larger drawdowns approximately every few months throughout its existence. The 2017 bull run saw multiple 30-40% corrections before reaching its then-peak of nearly $20,000. The 2021 cycle witnessed several sharp pullbacks exceeding 50% from local highs.
However, what distinguishes this current Bitcoin 20% slide from previous corrections is the improved market infrastructure, increased institutional participation, and supposedly a more mature investor base. Many believed these factors would reduce volatility. This correction suggests that old patterns persist despite market evolution.
Market Structure: The Hidden Architecture Behind the Drop
Leverage and Liquidation Cascades
One of the primary structural factors contributing to Bitcoin’s 20% slide involves the extensive use of leverage in cryptocurrency derivatives markets. Data from major exchanges shows that open interest in Bitcoin futures and perpetual swaps had reached multi-month highs before the selloff began.
When Bitcoin’s price began declining, highly leveraged long positions faced margin calls. As these positions were liquidated, they created additional selling pressure, which triggered more liquidations—a phenomenon known as a liquidation cascade. Analytics firms reported over $2 billion in leveraged long positions being liquidated within 48 hours during the steepest part of the decline.
This mechanism operates independently of fundamental news. Market structure itself becomes the catalyst for price movement. The interconnected nature of modern cryptocurrency trading, with its algorithmic trading bots and cross-exchange arbitrage, amplifies these effects exponentially.
Order Book Depth and Liquidity Challenges
Despite Bitcoin’s maturation as an asset class, liquidity issues remain a significant structural concern. Analysis of exchange order books reveals that the actual depth of readily available liquidity is surprisingly shallow at certain price levels. Large sell orders can move the market significantly when they exceed available bid liquidity.
During Bitcoin’s 20% slide, market observers noted that order book depth had been deteriorating in the weeks leading up to the correction. Fewer large buy orders were sitting on exchanges, meaning that even moderate selling pressure could push prices down more aggressively than during periods of deeper liquidity.
The fragmented nature of cryptocurrency markets—with dozens of major exchanges and hundreds of trading pairs—further complicates liquidity. A coordinated sell-off across multiple venues can quickly exhaust available buyers at key psychological price levels.
Derivatives Market Influence on Spot Prices
The relationship between Bitcoin’s derivatives markets and spot prices has become increasingly complex. Many traders now argue that the tail wags the dog—that futures and options markets drive spot price movements rather than the reverse.
Leading up to the correction, funding rates on perpetual swaps had reached elevated levels, indicating that traders were paying significant premiums to maintain long positions. This typically signals overcrowded trades and can precede corrections as traders eventually close positions to avoid mounting funding costs.
Additionally, large options expiries create gravitational pulls on spot prices as market makers hedge their positions. The weeks preceding Bitcoin’s decline saw significant options open interest clustering around specific strike prices, potentially contributing to the volatility we witnessed.
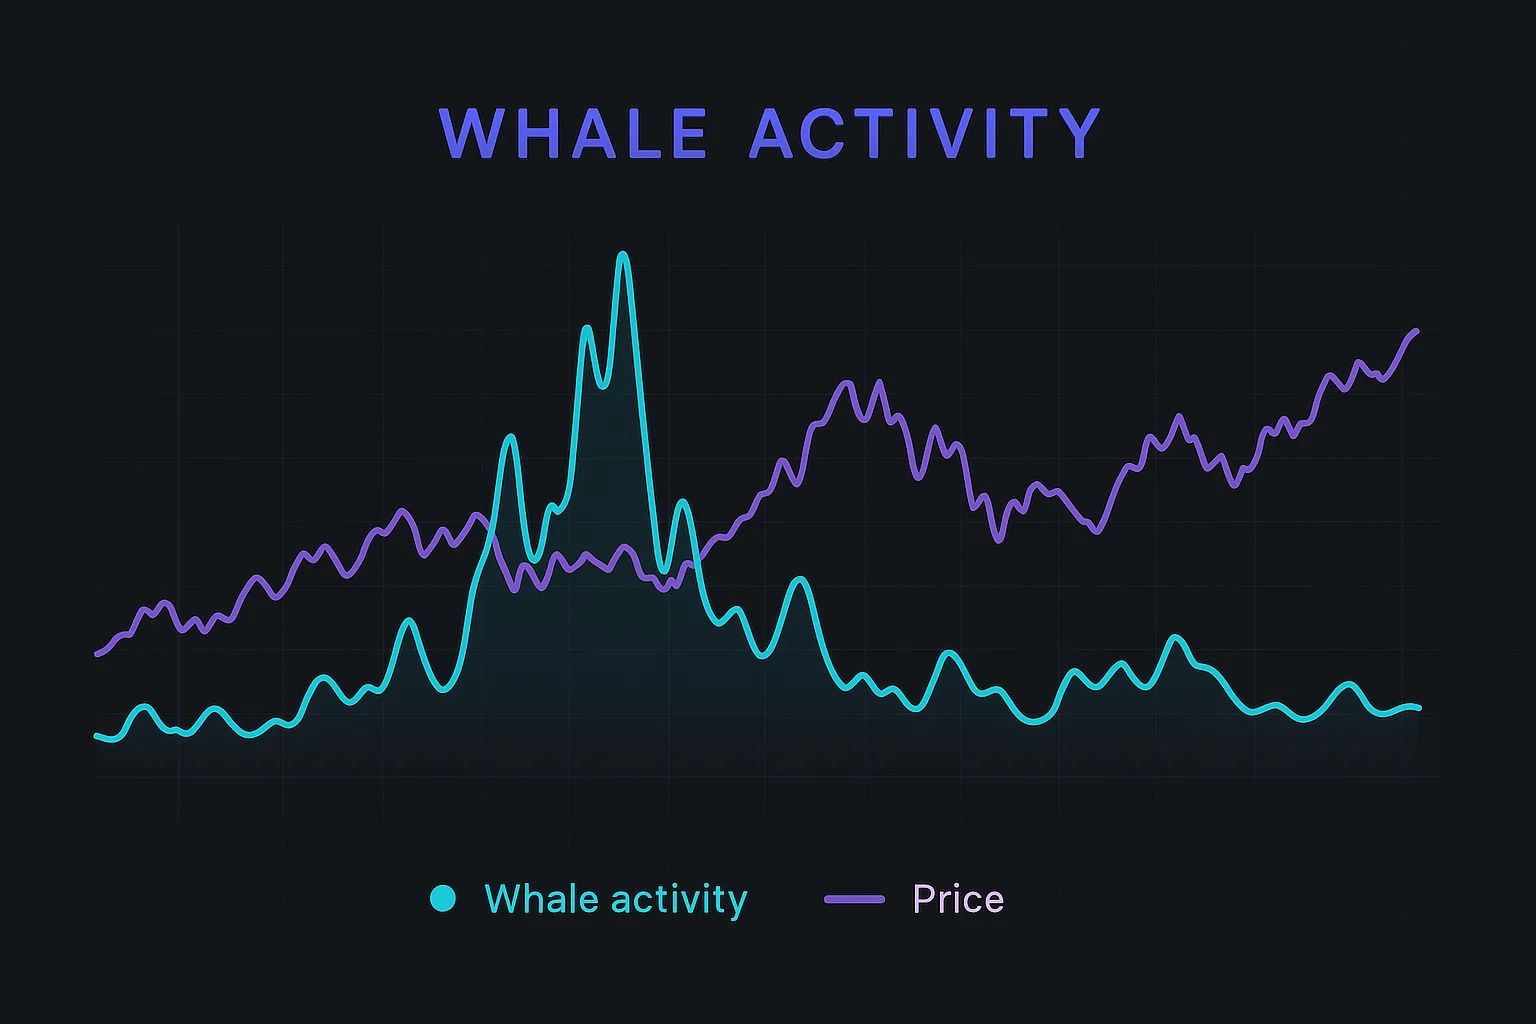
Whale Activity: Following the Smart Money
Identifying Whale Movements Through On-Chain Data
One of cryptocurrency’s unique advantages is the transparency of blockchain data. Through on-chain analysis, researchers can track the movement of large Bitcoin holdings—what the community calls “whale wallets.” During Bitcoin’s 20% slide, on-chain metrics revealed fascinating patterns.
Data from blockchain analytics firms showed that wallets holding more than 1,000 BTC had been steadily reducing their holdings for approximately two weeks before the broader market decline accelerated. These entities moved substantial amounts of Bitcoin to exchanges, typically a precursor to selling activity.
Interestingly, this whale distribution pattern occurred without any obvious catalysts, suggesting that sophisticated holders may have been taking profits based on technical indicators, macroeconomic concerns, or simply reaching predetermined exit points in their investment strategies.
Exchange Inflows and Outflows
Monitoring Bitcoin flows to and from exchanges provides crucial insights into market sentiment. An increase in exchange inflows typically indicates potential selling pressure, as investors move assets to exchanges primarily for trading or selling purposes.
Data preceding Bitcoin’s 20% slide showed elevated exchange inflows from long-term holder addresses—wallets that had remained dormant for months or years. This movement of “old coins” often correlates with market tops or significant corrections, as early investors who acquired Bitcoin at much lower prices decide to realise gains.
Conversely, exchange outflows—Bitcoin moving from exchanges to private wallets—suggest accumulation and typically indicate bullish sentiment. During the correction, outflows decreased significantly, suggesting that potential buyers were waiting for lower prices rather than aggressively accumulating during the dip.
Whale Accumulation vs. Distribution Patterns
Not all large holders behaved identically during the correction. While some whales were clearly distributing, on-chain data revealed that other large wallets were accumulating, purchasing Bitcoin at progressively lower prices during Bitcoin’s 20% slide.
This divergence in whale behaviour reflects different investment time horizons and risk tolerances. Some entities appear to be short-term traders capturing profits from recent rallies, while others view the correction as a buying opportunity within a longer-term bullish framework.
The question for retail investors becomes: which whales should you follow? Historical data suggests that accumulation by entities with longer holding periods tends to precede eventual price recovery, though timing remains uncertain.
The Psychology Behind Bitcoin’s Decline
Fear and Greed Cycles in Cryptocurrency Markets
The Fear and Greed Index, a popular sentiment indicator in crypto markets, provides valuable insight into the psychological underpinnings of price movements. Before Bitcoin’s 20% slide began, the index had entered “extreme greed” territory, signalling that market participants had become overly optimistic.
This euphoric sentiment created conditions ripe for correction. When initial selling began, the rapid sentiment shift from extreme greed to fear created a self-reinforcing cycle. Investors who had entered positions during the euphoria phase, often with insufficient risk management, panicked as prices declined, accelerating the selloff.
Market psychology in cryptocurrency remains distinctly different from traditional assets. The 24/7 trading, high volatility, and prevalence of retail participation create conditions where emotional decision-making often overwhelms rational analysis.
The Herding Effect and Social Media Amplification
Social media platforms have become powerful amplifiers of both bullish and bearish sentiment in cryptocurrency markets. During Bitcoin’s 20% slide, social media sentiment analysis showed a dramatic shift in tone and messaging.
Initially, influencers and prominent accounts were calling the dip a “buying opportunity,” but as the decline continued, the narrative shifted to concerns about a bear market. This changing narrative contributed to the herding effect, where individual investors mimic the behaviour of others, often abandoning their own analysis in favour of following the crowd.
The algorithmic nature of social media platforms means that negative content about Bitcoin price corrections receives engagement (likes, shares, comments), which in turn amplifies its reach. This creates feedback loops where negative sentiment generates more negative sentiment, contributing to selling pressure even in the absence of fundamental catalysts.
Retail vs. Institutional Behaviour Patterns
The composition of market participants significantly influences price behaviour during corrections. Retail investors typically exhibit more emotional trading patterns, with a higher propensity to panic sell during downturns and FOMO buying during rallies.
Data from retail-focused exchanges showed disproportionately high selling activity from smaller accounts during the steepest portion of Bitcoin’s 20% slide. These investors, often less experienced and more levered, contributed to the cascade effect.
Institutional investors, while generally more disciplined, are not immune to psychological pressures. Quarterly performance pressures, redemption requests from clients, and risk management protocols can force institutional selling even when long-term conviction remains intact. Some analysts suggested that institutional profit-taking after Bitcoin’s approach to $100,000 contributed meaningfully to the correction.
Technical Analysis: Chart Patterns and Key Levels
Critical Support and Resistance Zones
From a technical analysis perspective, Bitcoin’s 20% slide can be explained through the lens of support and resistance levels. Bitcoin had been rejected multiple times at the $100,000 psychological barrier, creating a strong resistance zone that the price could not breach sustainably.
Once selling began and Bitcoin broke below critical support levels around $95,000, technical traders recognised a confirmed downtrend. This triggered algorithmic selling and stop-loss orders, accelerating the decline toward the next major support zone around $80,000.
The $80,000 level has historical significance as a previous consolidation zone and represents both a technical support level and a psychological price point. The response at this level would determine whether the correction would deepen or stabilise.
Moving Averages and Trend Indicators
Key moving averages provided early warning signals before Bitcoin’s 20% slide intensified. The 50-day moving average had been declining relative to price, creating a narrowing gap that often precedes corrections. When Bitcoin’s price crossed below this important moving average, it confirmed a shift in the short-term trend.
Longer-term moving averages, such as the 200-day MA, remain above current prices, suggesting that the broader uptrend may still be intact despite the correction. However, the distance between price and these longer-term averages had been stretched, indicating that mean reversion was statistically probable.
Momentum indicators like the RSI (Relative Strength Index) had shown divergence before the decline began. While prices made new highs, RSI failed to confirm, suggesting weakening upward momentum—a classic bearish divergence pattern that often precedes corrections.
Volume Analysis and Selling Pressure
Volume analysis during Bitcoin’s 20% slide revealed important information about the nature of the selloff. Selling volume was significantly elevated during the initial decline, indicating strong conviction among sellers rather than mere profit-taking.
However, as prices approached the $80,000 support zone, volume began to diminish, suggesting potential exhaustion of selling pressure. This volume profile pattern—high volume during the decline, decreasing volume at potential support—often precedes at least temporary stabilisation or bounce.
The distribution of volume across different price levels, visible in volume profile analysis, showed that substantial trading had occurred between $85,000-$90,000, creating a high-volume node that may act as a magnet for future price action.
Macroeconomic Factors and Bitcoin Correlation
Interest Rates and Risk Asset Correlation
While Bitcoin’s 20% slide occurred without specific bad news in the crypto space, broader macroeconomic conditions played an important role. Bitcoin has increasingly traded in correlation with traditional risk assets, particularly technology stocks.
During the correction period, concerns about interest rate policy and global economic growth affected risk appetite across all markets. As investors became more risk-averse, they reduced exposure to volatile assets like cryptocurrency, even in the absence of crypto-specific negative news.
The correlation between Bitcoin and the Nasdaq has strengthened considerably over recent years. When tech stocks experience selling pressure, Bitcoin typically follows. This correlation challenges the narrative of Bitcoin as a non-correlated alternative asset and suggests that macroeconomic conditions indirectly triggered the crypto selloff.
Dollar Strength and Cryptocurrency Weakness
The U.S. Dollar Index strengthened during the period of Bitcoin’s decline, reflecting a flight to safety among global investors. Historically, dollar strength has correlated negatively with Bitcoin prices, as a stronger dollar makes dollar-denominated assets like Bitcoin more expensive for international buyers.
Additionally, dollar strength often reflects tightening financial conditions globally, which reduces liquidity available for speculative assets. The combination of dollar strength and reduced global liquidity created headwinds for cryptocurrency markets independent of sector-specific news.
Global Economic Uncertainty
Geopolitical tensions, inflation concerns, and uncertainty about economic growth trajectories contributed to a general risk-off sentiment across markets. While not directly related to Bitcoin, these macro factors influenced the investment environment in which Bitcoin’s 20% slide occurred.
Sophisticated investors consider these broader market conditions when making allocation decisions. As uncertainty increased, portfolio managers likely reduced exposure to higher-volatility assets like cryptocurrency, contributing to selling pressure across the sector.
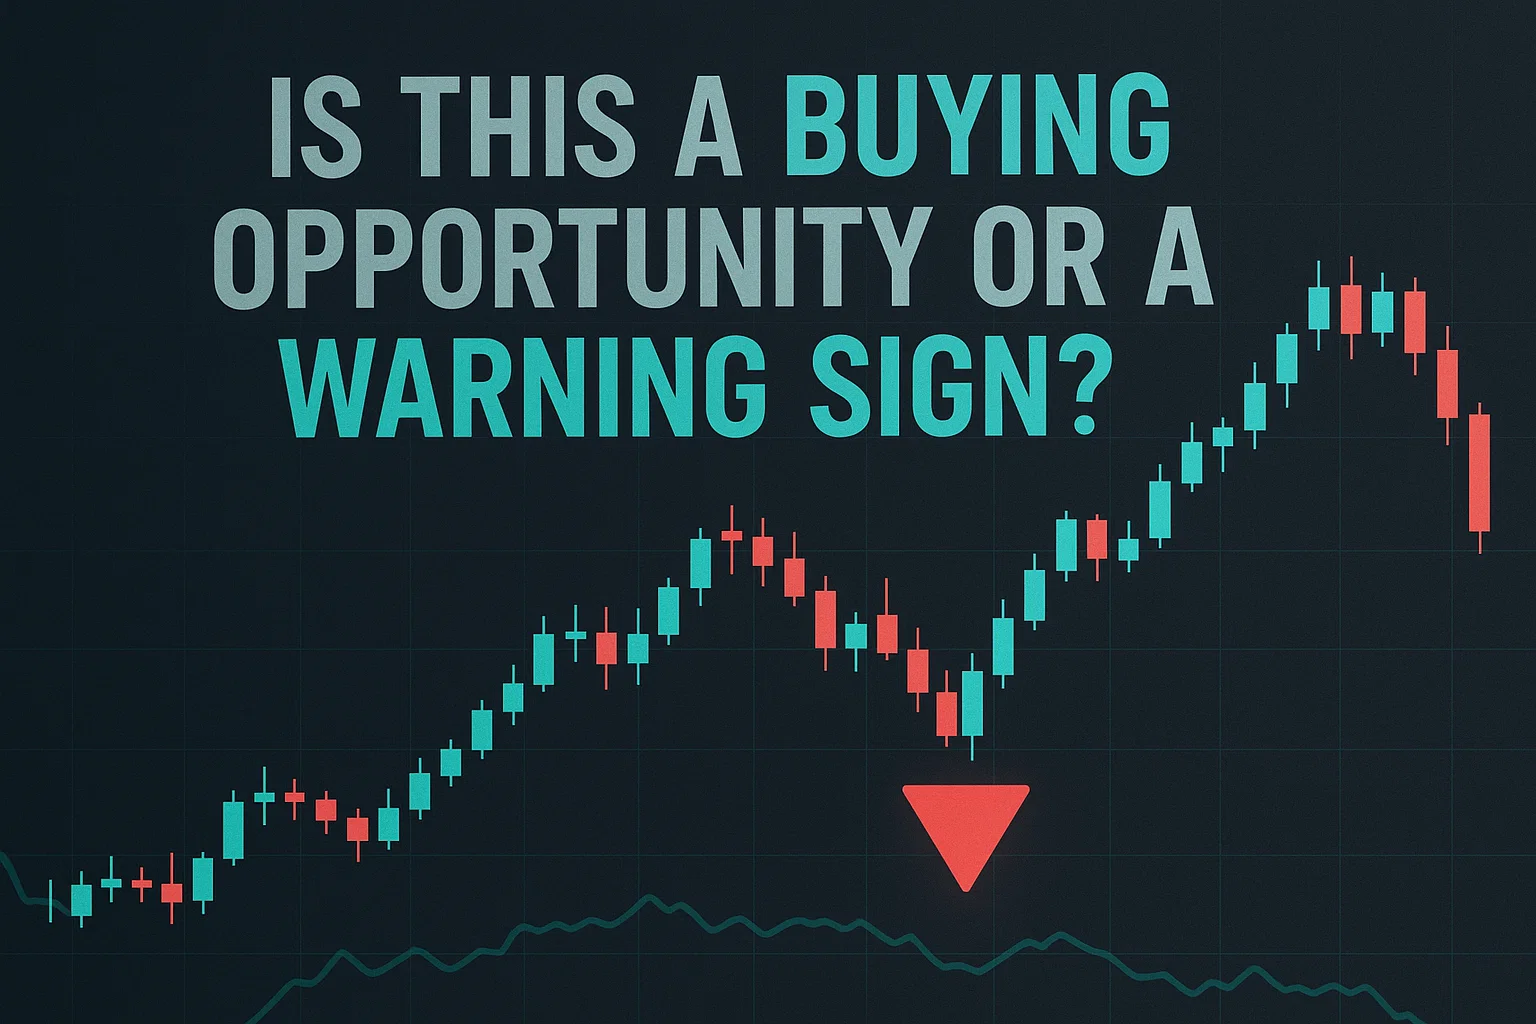
Is This a Buying Opportunity or a Warning Sign?
Historical Performance After Major Corrections
Examining Bitcoin’s behaviour after previous 20%+ corrections provides valuable context for current investors. Historical data shows that Bitcoin has recovered from every prior correction, often reaching new all-time highs within 6-12 months.
However, past performance never guarantees future results. Each market cycle occurs under different conditions with different participant profiles. The question investors must answer is whether Bitcoin’s 20% slide represents a healthy correction within an ongoing bull market or the beginning of a more extended bear market.
Dollar-cost averaging strategies have historically performed well following major corrections, as they capitalise on lower prices without trying to perfectly time the bottom. Investors who accumulated during previous 20-30% corrections generally achieved favourable outcomes over subsequent 12-24 month periods.
Key Indicators to Watch for Recovery
Several indicators can help identify when Bitcoin’s recovery might begin. On-chain metrics like the MVRV ratio (Market Value to Realised Value) can signal when Bitcoin is statistically undervalued relative to its cost basis. During the correction, MVRV approached levels that historically preceded recoveries.
Exchange reserves also merit attention. If Bitcoin begins flowing off exchanges (into cold storage), it suggests reduced selling pressure and accumulation by long-term holders. Conversely, continued exchange inflows would indicate persistent distribution.
Technical indicators like moving average crossovers, RSI exiting oversold territory, and volume patterns will provide clues about shifting momentum. A decisive reclaim of the 50-day moving average would signal a potential trend reversal.
Risk Management Strategies for the Current Market
Regardless of whether Bitcoin’s 20% slide represents an opportunity or a warning, proper risk management remains essential. Investors should evaluate their position sizing, ensuring that cryptocurrency exposure remains appropriate relative to their overall portfolio and risk tolerance.
Stop-loss orders can protect against further downside, though in volatile crypto markets, these can sometimes be triggered prematurely by rapid price swings. An alternative approach involves mental stop-losses or predetermined exit points rather than automated orders.
Diversification within cryptocurrency holdings—rather than Bitcoin-only exposure—can reduce portfolio volatility. However, correlation among cryptocurrencies tends to increase during major corrections, limiting the protective benefits of diversification within the sector.
Conclusion
Bitcoin’s 20% slide without obvious negative catalysts demonstrates the complex interplay of market structure, whale behaviour, and psychological factors that drive cryptocurrency prices. Rather than a simple cause-and-effect relationship between news and price, this correction illustrates how technical market dynamics, leveraged positioning, and sentiment shifts can create significant volatility independent of fundamental developments.
For investors, the key takeaway is that cryptocurrency markets remain immature in many respects despite growing institutional adoption. Structural factors like liquidation cascades, on-chain whale movements, and psychological herding effects continue to dominate price action, often overwhelming fundamental analysis.
Read More: Bitcoin Price Drops Below $96K: Fed Rate Cut Impact